


Use of Fluorescence Nanoparticle Tracking Analysis as a tool for quality assessment of EVs
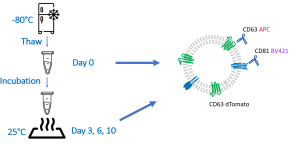
Correct and standardized storage conditions of extracellular vesicles (EVs) are essential prerequisites for the stability of clinical samples and the production of consistent EV batches
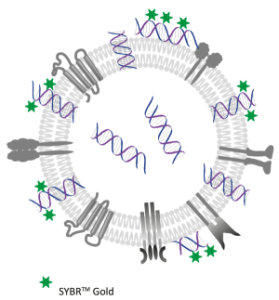
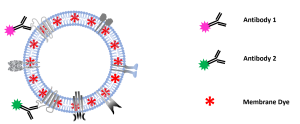
Detection of nucleic acid cargo in EVs by using Fluorescence Nanoparticle Tracking Analysis
The use of fluorescence nanoparticle tracking analysis (F-NTA) enables the detection of membrane-associated nucleic acids from EVs.

Analysis of 25 nm functionalized QDs using fluorescence-NTA with ZetaView® QUATT system
Application Note Download Abstract While it is uncertain how far the NTA community is able to push the limits of current technology in order to
Colocalization-NTA of multi-stained platelet derived MSC-EV preparations
After successfully showing C-NTA of double-stained MSC-EVs in our previous study (https://bit.ly/43GG0Yk) and confirming
the results with image flow cytometry, this note describes C-NTA
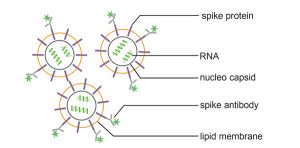
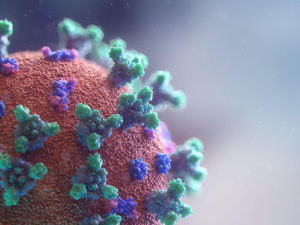
Specific detection of SARS-CoV-2 corona virus from cell culture supernatants by fluorescence-based Nanoparticle Tracking Analysis
In this new application note we describe a quick determination of the physical titer of coronaviruses by fluorescence-based Nanoparticle Tracking Analysis and specific spike antibody
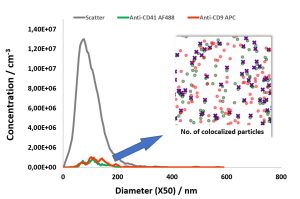
NTA goes colocalization:
Detection and measurement of CD9 and CD41 on
double-stained human platelet derived MSC-EV
preparations
In this report, we describe the quantification of colocalization ratios on double-stained MSC-derived EVs using fluorochrome conjugated antibodies against the
cell surface antigens CD9
High Throughput ZetaView® System vs High Cost of Other Methods
In addition to using Nano Particle Tracking Analysis (NTA) to measurement the size distribution and concentration of EV samples, both Microfluidic Resistive Pulse Sensing (MRPS)
Avoiding Artifacts in EV samples:
Part 1 – the Use of Tween®
Along with generally accepted methods are some “tricks of the trade” such as the addition of Tween® or BSA; however, some of those additions are
Rapid determination of purity, integrity and titer
of viruses by Fluorescence Nanoparticle Tracking
Analysis (F-NTA) using the bacteriophage Phi6
Determination of the titer of viruses and bacteriophages is an indispensable key technology in virological research and for diagnostic purposes. Depending on the method used,
Principles of Colocalization-NTA
Platinum Presenter Talk at ISEV 2022 in Lyon Dr. Clemens Helmbrecht NTA is a multi-parameter technology Nanoparticle Tracking Analysis (NTA) is well known for measuring
Three in One: Concentration, Size & Zeta Potential measured on sub-visible protein suspensions
The preparation of high-value biological material, such as proteins, requires a multi-step procedure of separation and purification. Each step must be optimized to reach full
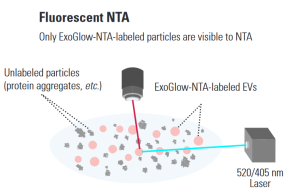
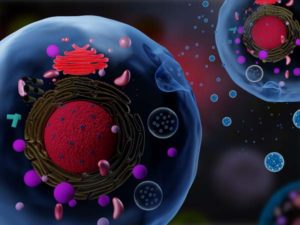
Detect only extracellular vesicles with Nanoparticle Tracking Analysis (NTA)
Making a great exosome research tool even better, SBI has developed ExoGlow TM -NTA, a proprietary dye that enables fluorescent analysis of only the extracellular
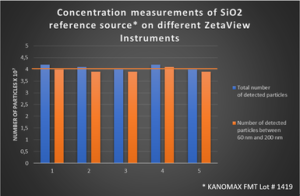
Reliability of concentration measurements with the Particle Metrix ZetaView® Nanoparticle Tracking Analyzer
Concentration levels of extracellular vesicles have a high clinical potential as a reference for disease.
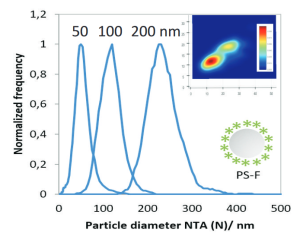
Phenotyping of EVs by Multi-Wavelength Fluorescence Nanoparticle Tracking Analysis
F-NTA of fluorescent labelled bionanoparticles is an efficient technique for quantification of size and total concentration.
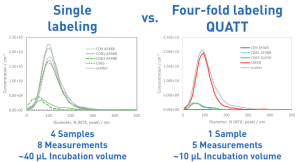
Evaluation of a Four Wavelength NTA Instrument for biomarker detection of cell line EVs
Shown with four-fold labeled EVs: Multi-wavelength NTA reduces total measurement time, minimizes the amount of sample required, and improves experimental reproducibility.
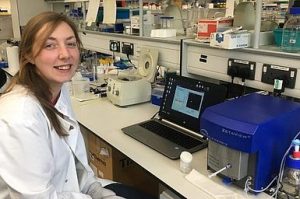
Researchers at Oxford Brookes University use the ZetaView® to study extracellular vesicles
The particular area of expertise focuses on investigating the roles of extracellular vesicles (EVs) in cancer and cellular stress responses.
ZetaView® Particle Tracking on Exosomes
From the same sample you get the parameters: number concentration, size, electrophoresis surface charge, sub-populations and fluorescence phenotyping in little time.
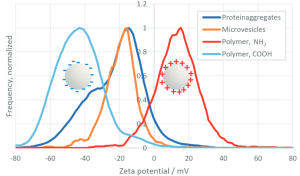
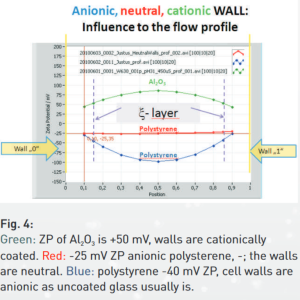
Surface Charge and Pattern Analysis – Differentiating Tools in Scanning NTA
Nanoparticle Tracking Analysis (NTA) combined with surface charge measurement enables the user to gain bio-chemical information about particle surface.
High efficiency quantification of fluorescent labeled EVs with F-NTA
Traditionally, detection of fluorescent particles (F-NTA) has been shown to be challenging due to bleaching effects known from laser induced fluorescence techniques (LIF).
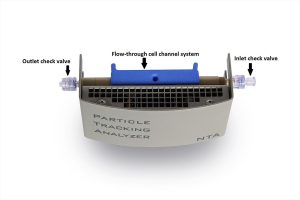
Limitation of sample volume: How to recover a sample after NTA measurement
Full recovery of samples measured by a nanoparticle tracking analyzer (NTA) often becomes challenging particularly if the samples are intended for further use after measurement.
Multi-wavelength F-NTA tool for nanoparticles in their natural liquid environment
From the same sample you get the parameters: number concentration, size, electrophoresis surface charge, sub-populations and fluorescence phenotyping in little time.
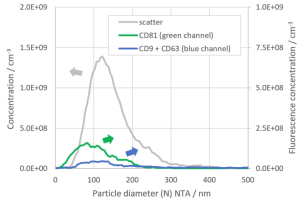
Identification of Exosomes using the tetraspanins CD9, CD63, CD81 and Particle Metrix ZetaView® fluorescent Nanoparticle Tracking (F-NTA)
Nanoparticle Tracking Analysis (NTA) has emerged as the state-of the-art method for size and concentration characterization of exosomes and extracellular vesicles.
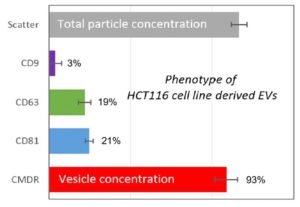
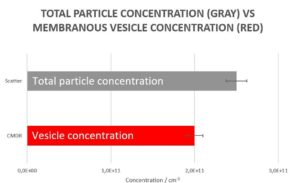
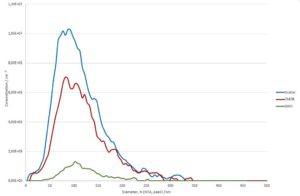
Characterization of Extracellular Vesicles via fluorescence Nanoparticle Tracking Analysis (F-NTA)
Here we report a unique technology for rapid determination of membranous particles along with an analysis of multiple EV biomarkers. In spite of the experimental
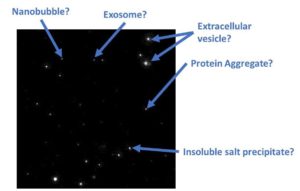
Purity check of Extracellular Vesicle preparations by Particle Metrix ZetaView® Nanoparticle Tracking Analysis
Over the past decade Nanoparticle Tracking Analysis (NTA) has emerged as an essential characterization tool for Extracellular Vesicle and Exosome research.
Identification of DNA / RNA containing Extracellular Vesicles with DAPI and Particle Metrix ZetaView® Nanoparticle Tracking
Here we report an easy and quick method to analyse size and concentration of nucleic acid containing EVs by fluorescent NTA (f-NTA) after staining with
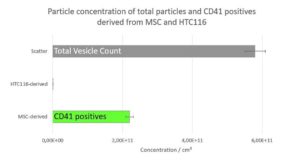
Identification of platelet-derived Exosomes in plasma samples with Particle Metrix ZetaView® Nanoparticle Tracking
Here we report a unique method to identify platelet-derived Exosomes from plasma samples using specific fluorescently labelled CD41 antibody and the Particle Metrix ZetaView® instrument.
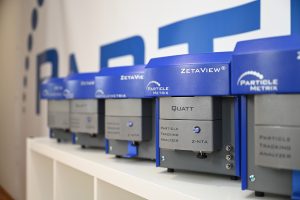
Product launch at ISEV 2019 in Kyoto of the ZetaView® QUATT
Classic NTA instruments are equipped with one laser, requiring phenotyping in sequence. Multi-fluorescence detection of four biomarkers on one sample by NTA is shown for
DKSH brings Particle Metrix’s ZetaView® for nanoparticle tracking analysis to Japan
DKSH and Particle Metrix have signed a distribution agreement to provide sales and technical services for its ZetaView® nanoparticle tracking analysis (NTA) system in the
DKSH and Particle Metrix sign exclusive distribution agreement in Australia and China
DKSH, the leading Market Expansion Services provider with focus on Asia, and Particle Metrix, a manufacturer of particle analysis instruments headquartered in Germany, have signed
How to measure the zeta potential of individual nanoparticles (NPs)?
To anticipate the answer: With the ZetaView®.
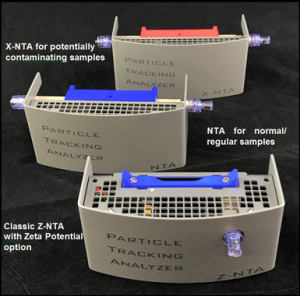
The Scanning Nano Particle Tracking Analysis (NTA) ZetaView® now for potentially hazardous samples
Particle Metrix now introduces two additional types of NTA Cell Assemblies: The new types are designed for concentration, size and fluorescence detection. When working in
Cell Guidance Systems use the ZetaView® from Particle Metrix for exosome research and quality control
Particle Metrix reports on how Cell Guidance Systems use the ZetaView® particle characterization system for exosome research and quality control.
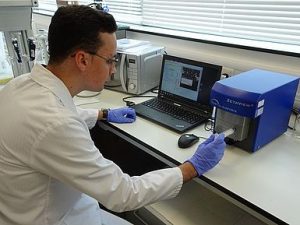
The Institute for Transfusion Medicine at the University Hospital of Duisburg-Essen in Germany uses the ZetaView® from Particle Metrix to quantify extracellular vesicles
Particle Metrix reports on the work of the Giebel Working Group on the Developmental Biology of Stem Cells in the Institute for Transfusion Medicine at
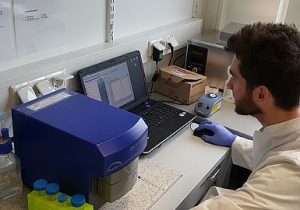
The Translational Research Center at the University Hospital of Erlangen in Germany uses the ZetaView from Particle Metrix to quantify extracellular vesicles such as exosomes
Particle Metrix reports on the work of the Baur Laboratory in the Department of Dermatology at the University Hospital of Erlangen.
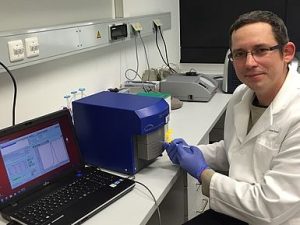
The Ottawa Hospital Research Institute uses the ZetaView® from Particle Metrix to study membrane microparticles as potential biomarkers for underlying diseases
Particle Metrix reports on the work of the Burger Laboratory at Ottawa Hospital Research Institute.
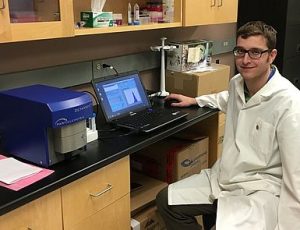
Augusta University’s Department of Cellular Biology & Anatomy is studying exosomes using ZetaView® from Particle Metrix to aid in identification of potential biomarkers
Particle Metrix reports on the work in the Liu Laboratory at Augusta University which is studying exosomes where size and concentration are critical parameters.