


High Throughput ZetaView® System vs High Cost of Other Methods
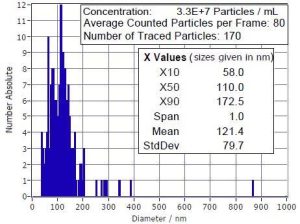
In addition to using Nano Particle Tracking Analysis (NTA) to measurement the size distribution and concentration of EV samples, both Microfluidic Resistive Pulse Sensing (MRPS) and the Single Particle Interference Reflectance Image Sensor (SP-IRIS) methods have been widely used as an alternative means of characterizing EVs. In this note, we relay two specific cases for using the ZetaView® NTA system to achieve relative “high-throughput” analysis of many EV samples, along estimations of throughput for MRPS & SPIRIS methods for an equivalent number of samples; further, we establish realistic estimates for the high cost of ownership for operating MRPS & SP-IRIS systems as a result of the cost of consumables as well as the substantially greater amount of time spent to run the same number of samples.