Nanoparticle Tracking Analysis
Welcome to the forefront of nanoparticle research with Nanoparticle Tracking Analysis (NTA). This leading-edge technology delivers unparalleled precision, flexibility, and actionable insights for science and industries such as pharmaceuticals, biotechnology, environmental science and materials research. At Particle Metrix we combine decades of expertise with German-engineered systems to offer cutting-edge solutions in nanoparticle analysis.
Nanoparticle Tracking Analysis?
Nanoparticle Tracking Analysis is an advanced technique for characterizing nanoparticles in suspension, covering a size range of 20 to 2000 nm. Using laser illumination and high-sensitivity CMOS cameras, NTA tracks the Brownian motion of every single nanoparticle in a sample in real time. By applying the Stokes-Einstein equation, the technology translates particle movement into precise size measurements.
But how can we measure particle size with such precision? The answer lies in the advanced mechanics of NTA. Each particle’s random motion, caused by molecular collisions in the surrounding fluid, is tracked by high-resolution imaging. This data is then translated into exact particle size through the Stokes-Einstein equation, making NTA one of the most reliable methods for particle size measurement.
NTA stands out from traditional methods such as Dynamic Light Scattering (DLS) by offering single-particle resolution, enabling the detection of subpopulations within complex mixtures. When comparing particle size analytical methods, the ability to measure each particle individually ensures that even heterogeneous samples can be characterized with unmatched precision. This makes NTA indispensable for research and industrial applications requiring accurate particle analysis.

The technology behind Nanoparticle Tracking Analysis
Understanding the most effective method for particle size analysis requires appreciating the technologies behind NTA. Here’s how it works:
Laser Illumination: A focused laser beam illuminates nanoparticles in liquid. Scattered light is captured as high-contrast images for precise tracking.
High-Resolution CMOS Cameras: Sensitive CMOS cameras enable real-time visualization of particles as small as 10 nm.
Brownian Motion Analysis: Random particle motion is tracked to determine mean square displacement, essential for size calculation.
Stokes-Einstein Equation: NTA derives particle size from Brownian motion using the Stokes-Einstein equation, ensuring high precision.
Fluorescence Detection: Up to four lasers with optical filters detect fluorescently labeled particles for biospecific tagging.
Colocalization Algorithms: Advanced NTA systems overlay fluorescence data to identify multiple biomarkers on the same nanoparticle.

Why Nanoparticle Tracking Analysis is superior?
Single-Particle Resolution: Provides detailed data on individual particles, not just averages.
Multi-Parameter Capabilities: Measures size, concentration, zeta potential, fluorescence, and colocalization in one workflow.
Broad Sensitivity Range: Detects particles as small as 10 nm at concentrations as low as 10⁵ particles/mL.
Real-Time Visualization: Enhances data accuracy by observing particles in motion.
Minimal Sample Requirements: Uses small volumes, reducing costs and waste.
Colocalization Analysis: Allows studying multiple co-expressed markers on the same vesicle.
By combining these features, NTA delivers unmatched precision and versatility in particle size analysis.
Advanced features of Particle Metrix Technology
Particle Metrix’s ZetaView® systems integrate a range of powerful features that redefine nanoparticle characterization. Among the various particle size analytical methods, NTA stands out for its precision and versatility:
Our ZetaView® systems are engineered to meet the highest standards, offering:
Comprehensive Analysis
Perform particle size measurement, zeta potential analysis, fluorescence detection, concentration measurement, subpopulation characterization, and colocalization — all in a single integrated workflow.
Multi-Laser Flexibility
Seamlessly analyze up to four fluorescence channels without manual adjustments.
Real-Time Monitoring
Instantly view particle size and concentration for an immediate overview of the sample composition.
Quartz Glass Cuvette
Handle larger sample volumes with minimal cleaning and no air bubble issues.
User-Friendly Design
Intuitive software and rapid setup ensure smooth operation.
Fast, Reliable Data
Generate high-quality results in minutes to speed up your experiments.
Customizable Solutions
Tailored configurations to meet the unique needs of your research.
German Engineering
With 20 years of experience, we set standards for precision and innovation.
Discover why Particle Metrix sets the standard in nanoparticle analysis. With ZetaView®, gain the tools you need to drive innovation and achieve exceptional results in your research.
Applications of Nanoparticle Tracking Analysis
NTA’s broad applicability makes it indispensable in research and industry:
Extracellular Vesicles (EVs): Enables precise characterization of EV size, concentration, and zeta potential for optimal EV characterization.
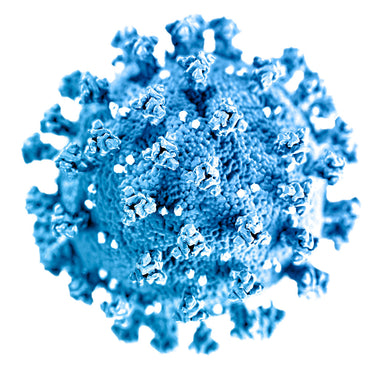
Viruses and Virus-Like Particles: Provides critical data on viral particle size, stability, and interaction dynamics, aiding vaccine development and therapeutic research.
Nanobubbles: Monitor bubble quality to optimizes performance for environmental remediation, wastewater treatment, and biomedical applications.
Pharmaceutical Applications: Ensures rigorous control over nanoparticle-based drug delivery systems for improved therapeutic outcomes.
Material Sciences: Characterizes metallic and polymeric nanoparticles for use in electronics, coatings, and catalysis.
Environmental Research: Tracks nanoparticles in waterfor pollution control and regulatory compliance.
Experience the future of nanoparticle research
Nanoparticle Tracking Analysis is the gold standard for nanoparticle research, delivering precision, versatility, and actionable insights. At Particle Metrix, we combine cutting-edge technology with unparalleled expertise to tackle your most complex challenges.
Contact us today to transform your nanoparticle analysis and advance your research.