Application Note

Specific detection of SARS-CoV-2 corona virus from cell culture supernatants by fluorescence-based Nanoparticle Tracking Analysis

Particle Metrix GmbH, Inning, Germany
Philipp Ostermann, Yvonne Dickschen, Heiner Schaal and Lisa Mueller
Institute for Virology, Heinrich-Heine University of Duesseldorf, Germany

Abstract

An indispensable key technology in virological research and diagnostics is the determination of a virus titer.
A distinction is made between the biological and physical titer. The biological or infectious titer indicates the amount of infectious particles that can cause a biological reaction. The physical titer, on the other hand, does not distinguish between infectious or non-infectious, replication-incompetent virus particles and measures only viral fragments such as viral proteins or genetic information. Especially in the production of virus-based
therapeutics, it is often essential to determine the total number of virus particles by a short, simple and precise measurement. Due to the ongoing situation of the coronavirus pandemic, we conducted our study with the B.1 wild type and the B.1.617.2 delta variant of the SARS-CoV-2 coronavirus. We show how the physical virus titer can be measured by using a specific spike protein antibody with the fluorescence detection capability of the
Particle Metrix ZetaView® instrument.

Keywords: SARS-CoV-2, spike antibody, virus titer fluorescence-based nanoparticle tracking, F-NTA, qPCR, detergent, vero cells

Introduction

For determination of virus titers, several methods are available:

I. By using qPCR, the viral load (copies/mL) in clinical samples or in virological research [1-3] can be calculated by quantifying viral nucleic acids from the cycle threshold (Ct) and a calibrator curve; however, without strict adherence to recognized standards and test controls, comparisons of viral load from laboratory to laboratory are often problematic. In addition, fragmented viral nucleic acids that may lack primer binding sites are not detected, nor does this method provide information on the integrity of the viral particles.

II. The tissue culture infectious dose 50 (TCID50) reflects the presence or absence of cytopathic effects after cells have been inoculated with serial dilutions of a virus solution. This method provides a qualitative and quantitative measurement and is defined as the virus dilution required to infect 50% of a given cell culture. Despite being the most commonly used method to determine biological virus titers, it is very time consuming and there are several protocols available to calculate the TCID50 [4-6].

III. The plaque assay, a derivative of the TCID50 assay, allows for a quantitative determination of infectious virus particles by quantifying plaques i.e. areas of lysed cells in a cell culture that are counted and determined as plaque-forming units (pfu) [7-9].

All three techniques are time consuming and require highly skilled laboratory personnel. Particularly in virological research and in the production of virusbased therapeutics, information about the total number of virus particles, whether infectious or not, is essential and should be able to be determined in a short, simple and precise measurement in order to keep laboratory work time efficient.

Due to the still ongoing coronavirus pandemic, we carried out our study with two different variants of SARS-CoV-2, the wild type variant B.1 and the delta variant B.1.617.2. All experiments were performed in a Biosafety Level-2 (BSL-2) facility using heat-inactivated virus solutions.

Figure 1: Electron microscope image of the SARS-CoV-2 B.1 wild type. Kindly provided by Dr. Philipp Ostermann, Institute for Virology, Heinrich-Heine University of Duesseldorf. Scale bar = 200 nm.

Using an antibody directed against the SARS-CoV-2 spike protein, we show successful measurement of both heat-inactivated SARS-CoV-2 variants via fluorescence-based Nanoparticle Tracking Analysis (F-NTA) without isolating the virions or purifying the cell culture supernatant beforehand (per fig. 2).

Figure 2: SARS-CoV-2 B.1 wild type and delta variant were specifically detected by using a spike antibody conjugated with Alexa Flour™ 488.

Material & Methods

Cell culture:

One day prior to infection, 1×10⁶ vero cells (ATCCCCL-81, obtained from LGC Standards) were seeded into T-75 cell culture flasks in maintenance medium (Dulbecco´s Modified Eagle Medium (Thermo Fisher), 2% fetal calf serum (PAN Biotech), 100 U/ml penicillin,
and 100 μg/ml streptomycin (Gibco)) and cultured at 37°C in a humidified cell culture incubator. The following day, infectious SARS-CoV-2 B.1 wild type (Wuhan-Hu-1) isolate EPI_ISL_425126 or delta variant EPI_ISL_3104827 were added. Supernatant was collected at day 4 post infection (dpi) and centrifuged at 500 x g for 10 minutes. Cell free supernatant was aliquoted and stored at -80°C. TCID50 was determined as previously described [10]. For SARS-CoV-2 B.1 wild type (Wuhan-Hu-1) isolate TCID50/ml was determined at 2.8×10⁶ and for delta variant, at 5×10⁵ TCID50/ml, respectively. Heat-inactivation of the samples was carried out at 60°C for 30 min, successful heat-inactivation was monitored via subsequent cell culture inoculation.

RNA extraction and qPCR:

For RNA extraction, 100 μl cell culture supernatant was incubated with 400 μl AVL buffer (viral lysis buffer
used for purifying viral nucleic acids; cat. No. 19073, Qiagen, Hilden, Germany) for 10 min at room temperature
and mixed with 400 μl 100% ethanol. For qPCR, analysis, RNA extraction was performed with the EZ1 Virus Mini Kit v2 (cat. No. 955134, Qiagen, Hilden, Germany) following the manufacturer´s instructions. 5 μl of the eluate was tested in qRT-PCR using the real-time TaqMan®-technique. A 113 base pair amplicon in the E-gene (envelope gene) of SARS-CoV-2 was amplified and detected, as described by Corman et al., 2020 [11] with minor modifications. We used the LightMix® Modular SARS and Wuhan CoV E-gene (Cat.-No. 53-0776-96) and the LightMix® Modular EAV RNA
Extraction Control. We used the AgPath-ID® One-Step RT-PCR Kit (Applied Biosystems, Cat. No. 4387391). qRT-PCR was performed with an ABI 7500 FAST sequence detector system (PE Applied Biosystems, Weiterstadt, Germany). As a DNA-standard, a plasmid (pEX-A128-nCoV2019-E-gene) that encompasses the amplified region was created and serially diluted after purification. The software constructed a standard graph of the Ct values obtained from serial dilutions of the standard. The Ct values of the unknown samples are plotted on the standard curves, and the number of SARS-CoV-2 RNA copies was calculated.

Lentiviral expression vectors:

Lentiviruses for verifying the specificity of the spikeantibody against the SARS-CoV-2 virions, were used.

Fluorescence antibody labelling:

For antibody labelling, 5 μl heat-inactivated cell culture supernatant of cells infected with the SARS-CoV-2 B.1 or delta variant were incubated with 5 μl of a 1:75 dilution of SARS-CoV-2 Spike Protein (RBD) Recombinant Human Monoclonal Antibody (P05DHu), Alexa Fluor™ 488 (Thermo Fisher Scientific, Cat. No. 53-6490-82) for two hours in the dark at room temperature. Afterwards, the mixture was supplemented with PBS buffer to 1000 μl and subjected to NTA measurement both in scatter and fluorescence modes. Care was taken to ensure that PBS buffer (Gibco, Fisher Scientific
Paisley, UK) was free of particles.

Mock controls were performed in the same way using cell culture supernatant of non-infected cells.

Lysis controls were prepared by using non-ionic detergent NP-40 Alternative (herein named NP-40) (Calbiochem, Merck, Darmstadt, Germany) in order to disrupt the membrane structure of the virus. NP-40 was first brought to a dilution of 0.5% with PBS buffer.
After finishing the incubation, 10 μl of 0.5% NP-40 solution were added to the labelling preparation and incubated 30 additional minutes at room temperature in the dark. Afterwards, the preparation was supplemented with PBS buffer to 1000 μl and subjected to NTA measurement in scatter and fluorescence mode.

Nanoparticle Tracking Analysis:

NTA measurements for size and concentration were carried out using a ZetaView® PMX-420 QUATT model equipped with the ZetaView-software version 8.05.14 SP7.
Table 1: Measurement parameters on a PMX-420 QUATT

NTA measurements for size and concentration were carried out using a ZetaView® PMX-420 QUATT model equipped with the ZetaView-software version 8.05.14 SP7.

Results & Conclusions

NTA detection in scatter & fluorescence mode:

NTA detection of the wild-type variant of heat-inactivated SARS-CoV-2 in scatter mode resulted in a concentration of 4.5×10⁹ particles per ml. This is the total particle count, which, in addition to virions, also includes all cell-derived particles and fragments, arising from a virus-infected cell culture. The median (X50) diameter is 118.6 nm, which is in good agreement with the literature [12]. The heat-inactivated cell culture supernatant infected with the delta variant resulted in a concentration of 1.2×10⁹per ml and a median (X50) diameter of 119.1 nm. Since these results do not provide a direct measure of the virus count in the supernatant of the infected cell culture, the virus titer was measured in fluorescence mode
using a specific fluorescently labelled spike antibody. F-NTA measurement of the wild-type variant resulted in a median diameter (X50) of 115.7 nm and a concentration of 5.3×10⁸. Likewise, the number of virions specifically measured with F-NTA in the delta variant yielded a concentration of 1.6×10⁸ per ml and a median diameter of 125.5 nm.

Figure 3: Example of an F-NTA measurement (red) of the wild type variant (top) and the delta variant (bottom) of SARS-CoV-2 labelled with a spike antibody (AF488) compared to scatter based NTA (grey).

Comparative experiments using quantitative PCR showed 1.08×10⁸ particles per ml for the wild-type variant and 3.9×10⁷ for the delta variant, which is lower than the particle number measured via F-NTA. As with qPCR, which not only detects nucleic acids packaged in the viruses, but also presumably free-floating viral RNA in the cell culture supernatant, and therefore overestimates the real virus titer, similar assumptions can be made for F-NTA measurements. In addition to intact virions, F-NTA would also detect incompletely assembled viruses or their fragments, provided they
have a membrane with spike proteins and their diameter is above the detection limit of the ZetaView® instrument. As with qPCR, this type of measurement is therefore a physical titer.

Detergent controls were carried out to ensure that the particles detected in fluorescence mode are actually SARS-CoV-2 virions. After treatment with 0.5% NP-40, the detergent will destroy the membrane of the virus resulting in a significant reduction or absence of the fluorescence signal from the spike antibody.

Figure 4: Summary of concentration measurements of the wild type (wt) and the delta variant of SARS-CoV-2 treated with and without NP-40. HIV-derived lentiviral expression vectors (LV) were used for checking the specificity of the spike antibody to the SARS-CoV-2 virions.

Figure 4 shows a summary of results for SARS-CoV-2 preparations treated with and without NP-40. In the detergent control, both, the wild type and the delta variant of SARS-CoV-2 showed a significant loss of the fluorescence signal, indicating that NP-40 causes complete lysis of the lipid layer and that SARS-CoV-2 virions were specifically detected via F-NTA. Further, the number of particles detected in scatter NTA mode was reduced by 74% for the wild type variant and 69% for the delta variant, both after NP-40 lysis.

As an additional negative control, HIV-derived lentiviruses (LV) showed no signal in the fluorescence measurements, after incubation with the spike
antibody, which further proves the antibody specificity. Furthermore, similar to both SARS-CoV-2 variants, the LVs showed a significant reduction of 31% in the particle concentration in the scatter mode after incubation with NP-40.

As shown in Figure 5, mock controls of non-infected cell culture supernatants showed significantly fewer particles in scatter mode compared to the supernatants of the infected vero cells, and as expected, no fluorescent particles after spike antibody incubation. The NP-40 detergent control showed a significant reduction of the detected particles (by 56%) proving the lysis of membranous particles derived from the cell culture. Other components also showed no fluorescence. Residual signals in scatter mode, after incubation with NP-40, indicate the presence of an abundance of non-membraneous particles such as salt crystals or protein aggregates, etc. in the supernatants.

Figure 5: Mock and negative controls using supernatants (SN) derived from non-infected vero cells. Furthermore, other components such as PBS, NP-40 and spike antibody were controlled for fluorescence detection.

Summary

In this study, we show specific detection of the wild type and delta variant of SARS-CoV-2 in the heat-inactivated supernatant of a virus-infected vero cell culture. By using F-NTA, we could clearly discriminate SARS-CoV-2 virions from other non-viral particles in the cell culture (see figure 4 and 5). In contrast to qPCR (based on the specific detection of viral nucleic acids), this study determined the amount of SARS-CoV-2 using their protein level signature. We were able to determine the concentration of SARS-CoV-2-derived particles by specifically binding fluorescently-labelled
spike antibodies to the viral spike protein. This method determines a physical virus titer, since no cytopathic effects caused by infectious virus are measured and virus-like particles, infectious or not, are detected. Particularly in virological research, and during the production of virus-based therapeutics, F-NTA provides a fast, simple and cost-effective method of total virus number.

References

1. Sastry, L., Johnson, T., Hobson, M. J., Smucker, B., & Cornetta, K.
Titering lentiviral vectors: comparison of DNA, RNA and marker expression methods. Gene Therapy 2002; 9, 1155—1162.

2. Forghani, B., Hurst, J. W., & Shell, G. R.
Detection of the human immunodeficiency virus genome with a biotinylated DNA probe generated by polymerase chain reaction. Molecular and Cellular Probes 1991; 5, 221—228.

3. Scherr, M., Battmer, K., Blomer, U., Ganser, A., & Grez, M.
Quantitative determination of lentiviral vector particle numbers by realtime PCR. BioTechniques 2001; 31, 520—524.

4. Chengfeng Lei, Jian Yang, Jia Hu, Xiulian Sun
On the Calculation of TCID50 for Quantitation of Virus Infectivity; Virol Sin. 2021 Feb; 36(1): 141–144.

5. LaBarre, D.D., & Lowy, R.J.
Improvements in methods for calculating virus titer estimates from TCID50 and plaque assays. J Virol Methods. 2001 Aug;96(2):107-26. doi: 10.1016/ s0166-0934(01)00316-0.

6. Bramhachari, P.V., Sheela, G.M., Prathyusha, A. M. V. N., Madhavi, M., K. Satish Kumar, K.S., Rao Reddy, N.N., and Chanda Parulekar Berde, C.P.
(2020).                                                                                                                                                                                                                            Advanced Immunotechnological Methods for Detection and Diagnosis of Viral Infections: Current Applications and Future Challenges. In: Bramhachari, P. (eds) Dynamics of Immune Activation in Viral Diseases. Springer, Singapore. https://doi.org/10.1007/978-981-15-1045-8_17

7. d’Hérelle F.
The bacteriophage and its behavior: Baltimore, Md.: The Williams & Wilkins Company; 1926.

8. Dulbecco R.
Production of Plaques in Monolayer Tissue Cultures by Single Particles of an Animal Virus. Proc Natl Acad Sci USA. 1952; 38(8):747–52.

9. Artur Yakimovich, Vardan Andriasyan, Robert Witte, I-Hsuan Wang, Vibhu Prasad, Maarit Suomalainen, Urs F. Greber;
Plaque2.0—A High-Throughput Analysis Framework to Score Virus-Cell Transmission and Clonal Cell Expansion; PLoS ONE 2015; 10(9): e0138760. doi:10.1371/journal.pone.0138760

10. Ramani et al.
SARS-CoV-2 targets neurons of 3D human brain organoids; The EMBO Journal (2020)39:e106230 https://doi.org/10.15252/embj.2020106230

11. Corman, V. M. et al.
Detection of 2019 novel coronavirus (2019-nCoV) by real-time RT-PCR. Euro Surveill. 2020, Jan.23; 25(3): 2000045; doi: 10.2807/1560-7917.ES.2020.25.3.2000045

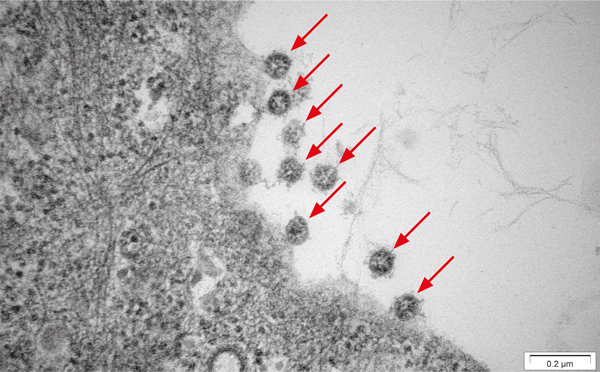
12. Laue M., Kauter, A., Hoffmann, T., Möller, L., Michel, J., Nitsche, A.
Morphometry of SARS-CoV and SARS-CoV-2 particles in ultrathin plastic sections of infected Vero cell cultures 2021. Nature Scientific Reports 11; 3515; https://doi.org/10.1038/s41598-021-82852-7


Disclaimer: While we have taken every care to ensure that the information in this document is correct, nothing herein should be construed as implying any representation or warranty as to its accuracy, correctness or completeness of this information and we shall not be held liable for any errors therein or for any damages in connection with the use of this material. Particle Metrix reserves the right to change the content of this material at any time without notice.

Copyright: © March 2023 Particle Metrix. This publication or parts thereof may not be copied or distributed without our express written permission..

Contact Form Sliding Bar
  • Step 1
  • Step 2

What can we do for you?


Your Contact Data

Please let us know how we can reach you. We will get in touch with you shortly.


Search

Cookies

Sie haben die Möglichkeit zu verhindern, dass von Ihnen hier getätigte Aktionen analysiert und verknüpft werden. Dies wird Ihre Privatsphäre schützen, aber wird auch den Besitzer daran hindern, aus Ihren Aktionen zu lernen und die Bedienbarkeit für Sie und andere Benutzer zu verbessern.