


Rapid determination of purity, integrity and titer
of viruses by Fluorescence Nanoparticle Tracking
Analysis (F-NTA) using the bacteriophage Phi6
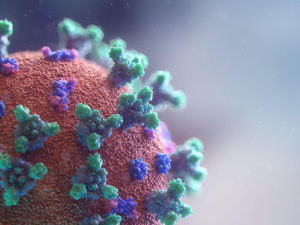
Determination of the titer of viruses and bacteriophages is an indispensable key technology in virological research and for diagnostic purposes. Depending on the method used, the measurements are either qualitative or quantitative, very time-consuming, and do not provide information about integrity or aggregation behaviour of the virus particles. Nanoparticle Tracking Analysis with the Particle Metrix ZetaView® instrument allows the user to perform a rapid concentration determination of virus particles. Using the bacteriophage Phi6 as an example, we show how titer, purity and integrity of phage particles can be measured quickly and reliably using the fluorescence detection capability of the Particle Metrix ZetaView® instrument.
Three in One: Concentration, Size & Zeta Potential measured on sub-visible protein suspensions
The preparation of high-value biological material, such as proteins, requires a multi-step procedure of separation and purification. Each step must be optimized to reach full efficiency of yield.
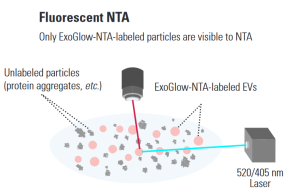
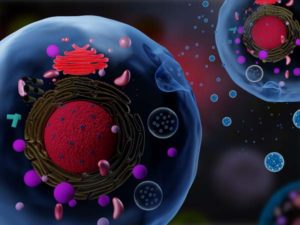
Detect only extracellular vesicles with Nanoparticle Tracking Analysis (NTA)
Making a great exosome research tool even better, SBI has developed ExoGlow TM -NTA, a proprietary dye that enables fluorescent analysis of only the extracellular vesicles (EVs) present in a heterogeneous sample.
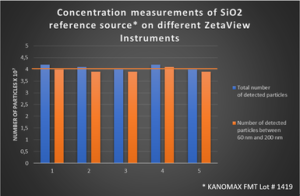
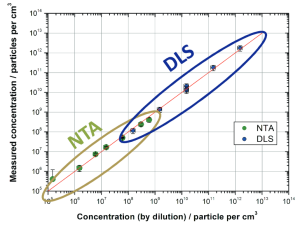
Reliability of concentration measurements with the Particle Metrix ZetaView® Nanoparticle Tracking Analyzer
Concentration levels of extracellular vesicles have a high clinical potential as a reference for disease.
Phenotyping of EVs by Multi-Wavelength Fluorescence Nanoparticle Tracking Analysis
F-NTA of fluorescent labelled bionanoparticles is an efficient technique for quantification of size and total concentration.
Evaluation of a Four Wavelength NTA Instrument for biomarker detection of cell line EVs
Shown with four-fold labeled EVs: Multi-wavelength NTA reduces total measurement time, minimizes the amount of sample required, and improves experimental reproducibility.
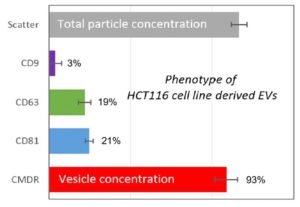
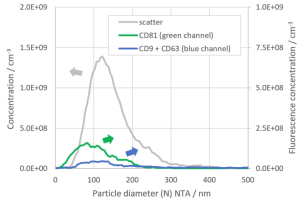
Identification of Exosomes using the tetraspanins CD9, CD63, CD81 and Particle Metrix ZetaView® fluorescent Nanoparticle Tracking (F-NTA)
Nanoparticle Tracking Analysis (NTA) has emerged as the state-of the-art method for size and concentration characterization of exosomes and extracellular vesicles.
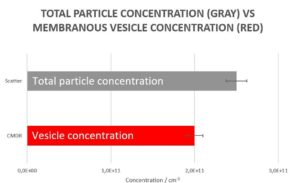
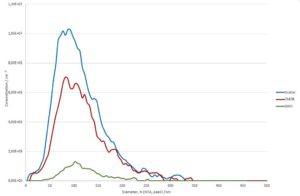
Purity check of Extracellular Vesicle preparations by Particle Metrix ZetaView® Nanoparticle Tracking Analysis
Over the past decade Nanoparticle Tracking Analysis (NTA) has emerged as an essential characterization tool for Extracellular Vesicle and Exosome research.
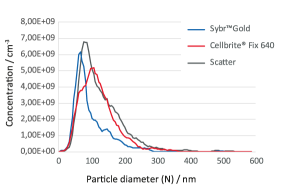
Identification of DNA / RNA containing Extracellular Vesicles with DAPI and Particle Metrix ZetaView® Nanoparticle Tracking
Here we report an easy and quick method to analyse size and concentration of nucleic acid containing EVs by fluorescent NTA (f-NTA) after staining with DAPI.
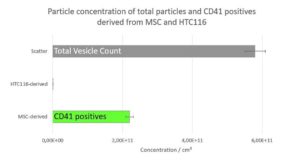
Identification of platelet-derived Exosomes in plasma samples with Particle Metrix ZetaView® Nanoparticle Tracking
Here we report a unique method to identify platelet-derived Exosomes from plasma samples using specific fluorescently labelled CD41 antibody and the Particle Metrix ZetaView® instrument.