Subpopulation Analysis
Subpopulation Analysis is a crucial step in understanding the complexity of heterogeneous samples. With Particle Metrix’s ZetaView® systems, researchers can accurately identify and characterize subpopulations within a single sample. This advanced capability provides detailed insights into sample heterogeneity, enabling breakthrough discoveries across various scientific and industrial fields.
What is Subpopulation Analysis?
Subpopulation Analysis refers to the ability to detect and distinguish distinct groups of particles within a complex mixture based on their unique physical or biological properties. By analyzing subpopulations based on optical properties, researchers can detect variations in size, charge, or composition. Fluorescence-based labeling further enhances specificity, enabling the identification of target particles within complex samples. This approach allows for precise differentiation between biomarker-positive particles and the total particle population, providing deeper insights into sample composition.
This level of detail is essential for studying complex samples containing biologically relevant particles like extracellular vesicles (EVs), therapeutic nanoparticles, or environmental particles. Identifying subpopulations helps researchers optimize isolation procedures, improve formulations, and ensure product consistency at a granular level. Key Attributes of Subpopulation Analysis:
Heterogeneity Detection: Distinguish subgroups of particles within complex samples, revealing size, charge, or fluorescence variations.
Advanced Characterization: Provides high-resolution data to uncover meaningful differences in particle properties.
Versatility Across Applications: Applicable to biological, synthetic, and environmental samples.
Why is Subpopulation Analysis important?
The ability to analyze subpopulations is critical for understanding the composition of samples in complex environments. This insight helps optimize isolation protocols, improve formulations, ensure quality control, and predict how particles interact within systems. For example:
In pharmaceuticals, subpopulation analysis identifies variations in therapeutic nanoparticles, helping to maintain consistent drug delivery and efficacy.
In biotechnology, researchers can detect and analyze subpopulations of EVs, offering insights into disease markers and cellular communication.
In environmental science, subpopulation analysis uncovers the behavior of pollutants and nanoparticles in ecosystems, supporting mitigation strategies.
Accurate subpopulation analysis ensures precise sample characterization, leading to improved outcomes in both research and industrial applications.
How is Subpopulation Analysis performed?
Subpopulation analysis uses Nanoparticle Tracking Analysis (NTA) with high-resolution imaging and fluorescence capabilities to identify and differentiate particle subgroups. The process involves:
- Illumination and Detection: A sample is illuminated using a laser, and particles are tracked with high-sensitivity CMOS cameras.
- Parameter Measurement: The system measures size, zeta potential, and detects fluorescence to identify unique subpopulations.
- Data Integration: Advanced algorithms analyze the collected data to separate and characterize distinct particle groups based on their properties.
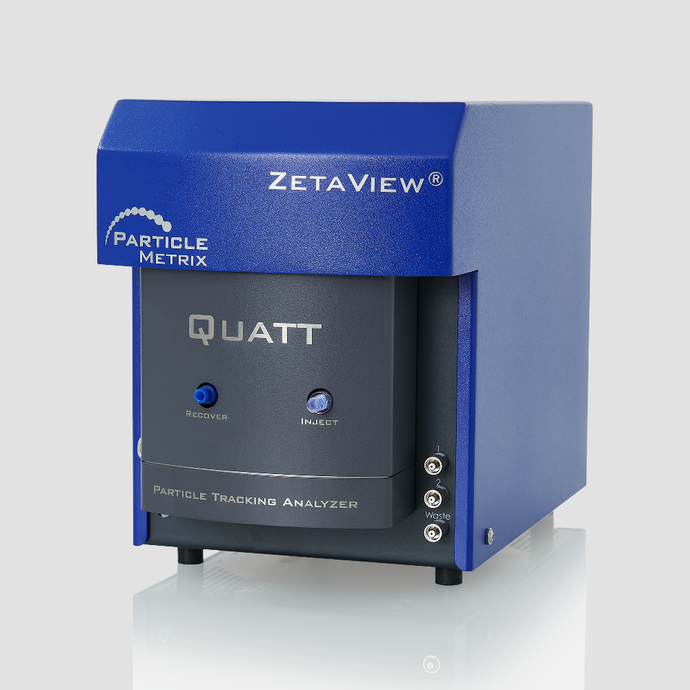
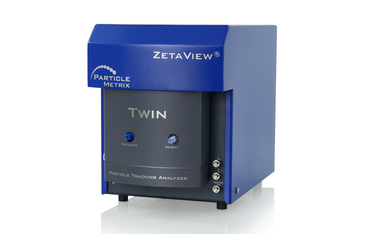
Advanced Subpopulation Analysis with ZetaView®
The ZetaView® system from Particle Metrix offers precise and automated subpopulation analysis, providing detailed profiles of heterogeneous samples. By integrating fluorescence capabilities, the system allows for targeted analysis of labeled subpopulations within a single sample.
Key advantages of ZetaView® for subpopulation analysis include:
High-Resolution Detection
Differentiate subpopulations based on size, charge, and fluorescence properties.
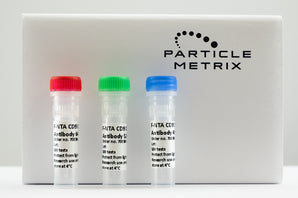
Fluorescence Integration
Identify and characterize specific labeled subpopulations, such as EVs and liposomes.
Multi-Parameter Measurements
Analyze size, concentration, and fluorescence simultaneously for a complete understanding of your sample.
Automated Workflows
Streamlined sample handling and analysis reduce operator workload and improve efficiency.
Versatile Applications
Tailored for biological, synthetic, and environmental samples, ensuring reliable results across disciplines.

Applications of Subpopulation Analysis
Subpopulation analysis is widely used in research, development, and quality control across numerous disciplines:
Pharmaceuticals: Distinguish between drug carriers with different properties to optimize delivery systems.
Biotechnology and Life Sciences: Analyze sample composition and subpopulations of extracellular vesicles and other biological particles for diagnostic and therapeutic research.
Materials Science: Characterize subpopulations of synthetic nanoparticles to enhance the performance of advanced materials.
Environmental Science: Detect and evaluate the behavior of distinct subpopulations of nanoparticles in fresh and waste water.
Let’s talk about your Subpopulation Analysis needs
If you’re interested in exploring how subpopulation analysis can enhance your research or product development, contact our team of experts. We provide personalized consultations, system demonstrations, and technical support to help you achieve your goals.
Frequently asked questions about Particle Subpopulation Analysis
What types of samples can be analyzed for subpopulations?
The ZetaView® system can analyze subpopulations in a variety of samples, including extracellular vesicles, synthetic nanoparticles, and environmental particles.
What are the advantages of using a Particle Metrix ZetaView® for subpopulation analysis?
Our technology provides high-resolution detection, fluorescence integration, and multi-parameter capabilities, delivering comprehensive insights into your samples.
How do I ensure accurate and reproducible subpopulation analysis?
Use high-quality fluorescent markers and our well-established staining protocols, prepare samples consistently, and maintain optimal instrument settings to achieve reliable results.
Can I analyze fluorescently labeled subpopulations?
Yes, the ZetaView® system supports fluorescence measurements, enabling detailed analysis of labeled subpopulations within complex samples.