Concentration Scanning Technology
A New Era in Nanoparticle Tracking Analysis
Over 20 years of expertise in Nanoparticle Tracking Analysis (NTA) led to the development of our new groundbreaking Concentration Scanning Technology. This innovative method enables a full sample scan that operates independently of measurement settings, allowing for the reliable determination of nanoparticle concentrations without the need for prior calibration – even for samples with unknown composition.
Discover what’s newNew online-shop – High-quality consumables for Nanoparticle Analysis
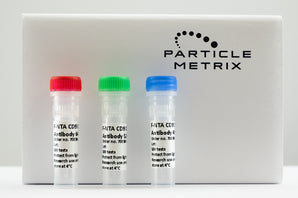
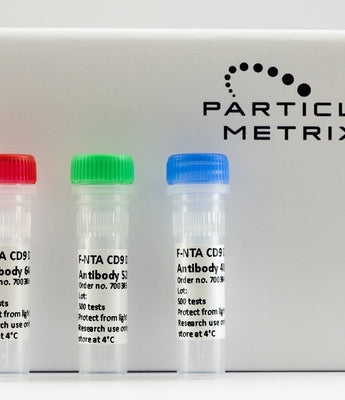
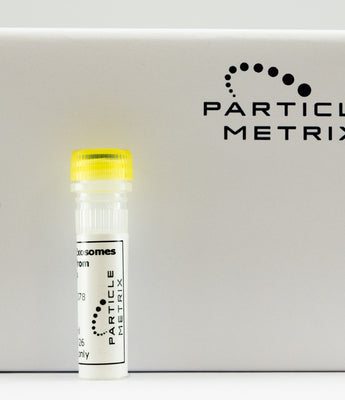
For the first time you can purchase premium consumables online – designed specifically for ZetaView® technology. Find lyophilized exosomes for calibration and validation and F-NTA antibodies for targeted particle characterization.
Optimize your nanoparticle analysis with reliable, high-quality consumables – now just a click away!
Unlock the power of Nanoparticle Tracking Analysis
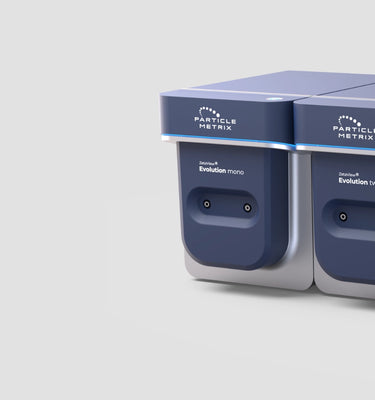
Experience unmatched precision and flexibility with Nanoparticle Tracking Analysis (NTA). This cutting-edge technology provides high-resolution insights for research and industry applications, from pharmaceuticals and biotechnology to environmental science and materials research.
At Particle Metrix we combine German engineering with decades of expertise to deliver state-of-the-art solutions for nanoparticle analysis.
Versatile Applications for cutting-edge research
From extracellular vesicles and viruses to nanobubbles, pharmaceuticals, materials science and environmental research – ZetaView® technology enables high-precision nanoparticle analysis across a wide range of applications.
Discover how Particle Metrix supports breakthrough research in your field.


Trusted by leading institutes and universities
Renowned research institutions and universities worldwide rely on Particle Metrix for high-precision nanoparticle analysis. Our collaborations drive cutting-edge discoveries in life sciences, nanomedicine and materials research.
Discover the prestigious partners who trust our ZetaView® technology for groundbreaking research.


Get in touch with our experts
Have questions about ZetaView® technology or need guidance on nanoparticle analysis? Our team is here to help! Whether you’re looking for personalized consultations, product information or technical support, we’re happy to assist you.
Contact us today and let’s find the best solution for your research needs!